1
Derivatives Rollover Report |November 27, 2020
For Private Circulation Only
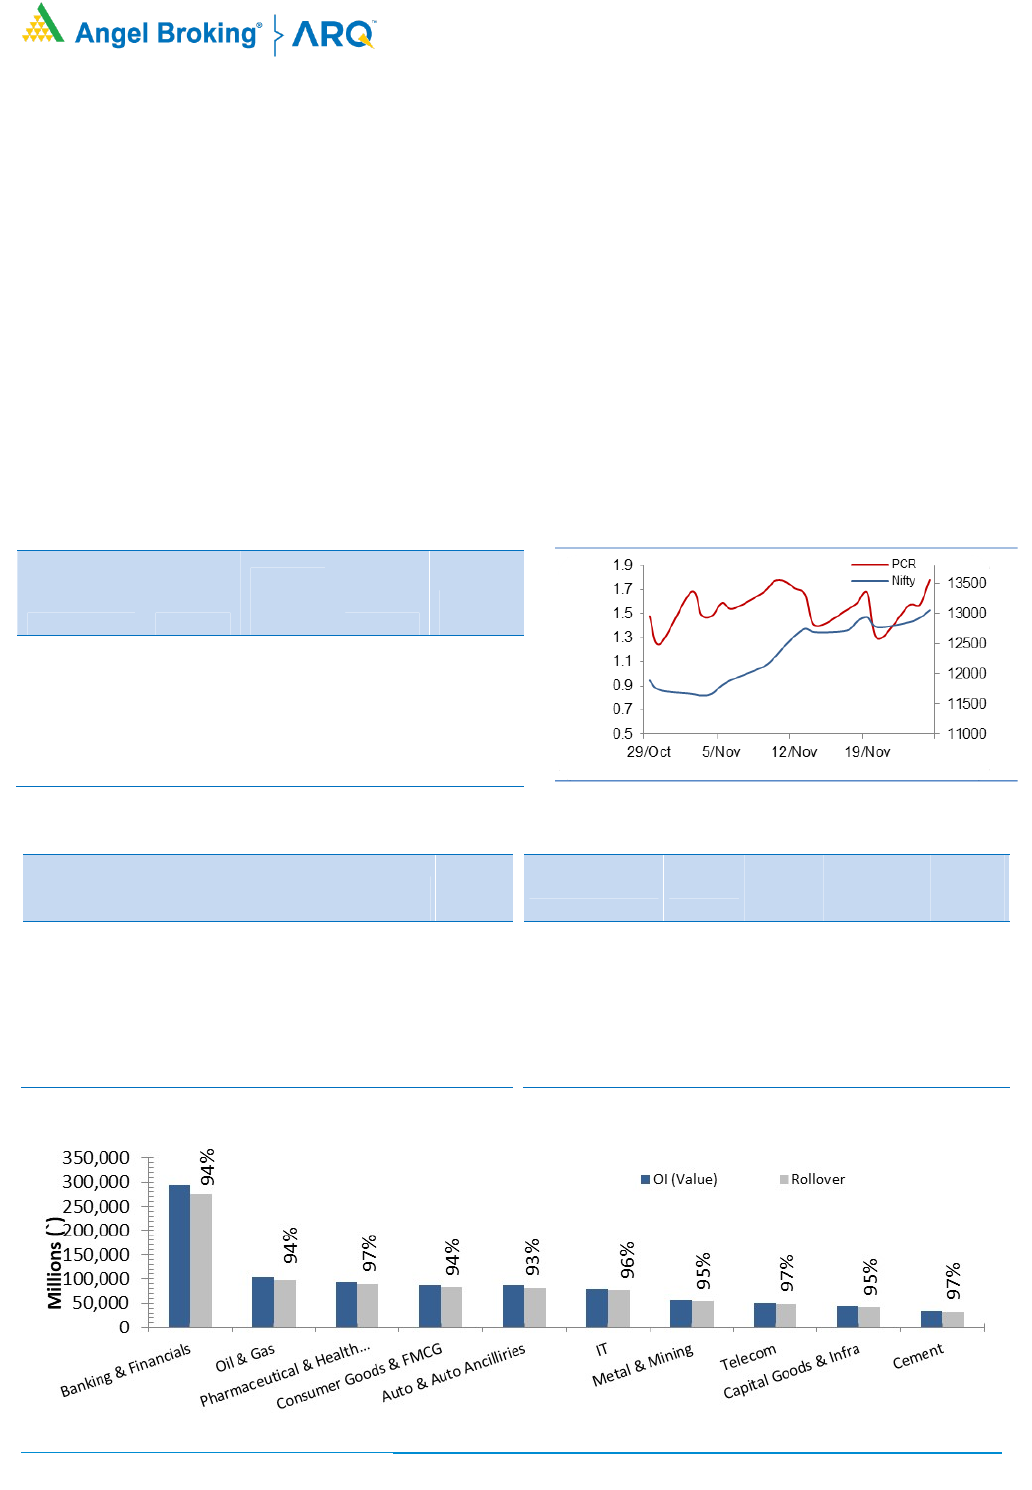
NIFTY & PCR Graph
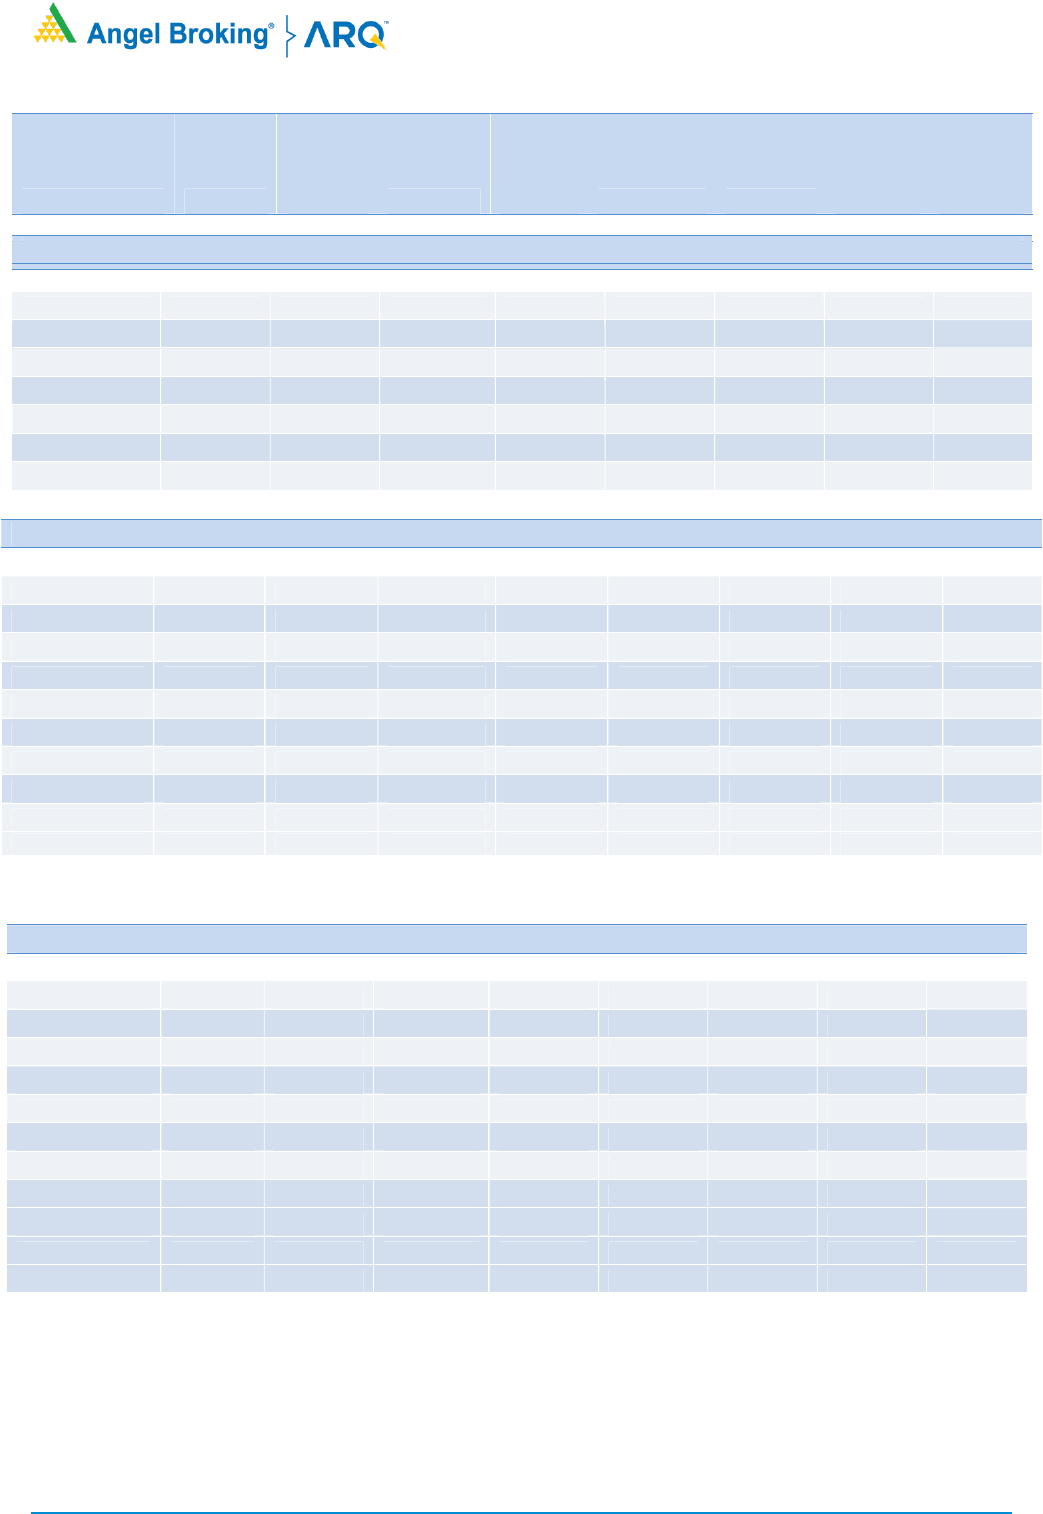
Monthly Gainers
Scrip Price
Price
Change
(%)
Open
Interest
Ol
Change
(%)
BAJAJFINSV 8835.65
56.97
907250
(24.77)
SRTRANSFIN 1052.95
51.05
3131823
(7.48)
INDUSINDBK 855.35
44.75
16529000
(38.48)
CHOLAFIN 361.25
44.41
4490000
2.10
BAJFINANCE 4825.00
43.08
4984000
24.15
Note: Stocks which have more than 1000 contract in Futures OI.
Monthly Losers
Scrip Price
Price
Change
(%)
Open
Interest
Ol
Change
(%)
MUTHOOTFIN 1137.05
(8.30)
5232000
99.94
UPL 422.85
(6.45)
23719800
36.81
RELIANCE 1959.20
(3.62)
35924360
(1.93)
PIDILITIND 1543.95
(3.16)
3075000
(8.85)
ASIANPAINT 2166.10
(2.71)
3579600
25.47
Note: Stocks which have more than 1000 contract in Futures OI.
It has been a historical series for the Indian equity market as we saw index clocking fresh record highs beyond the psycholog
ical mark of
13000. Post some consoli
dation on the first two trading sessions of November series, we saw strong buying emerging to propel the rally
towards 13150 mark. Eventually, we concluded the second consecutive series with whopping gains. However, this rally wouldn’t
have been
possible without the contribution of BankNifty, which rallied 22% in November series and almost 45% in the span of merely two series.
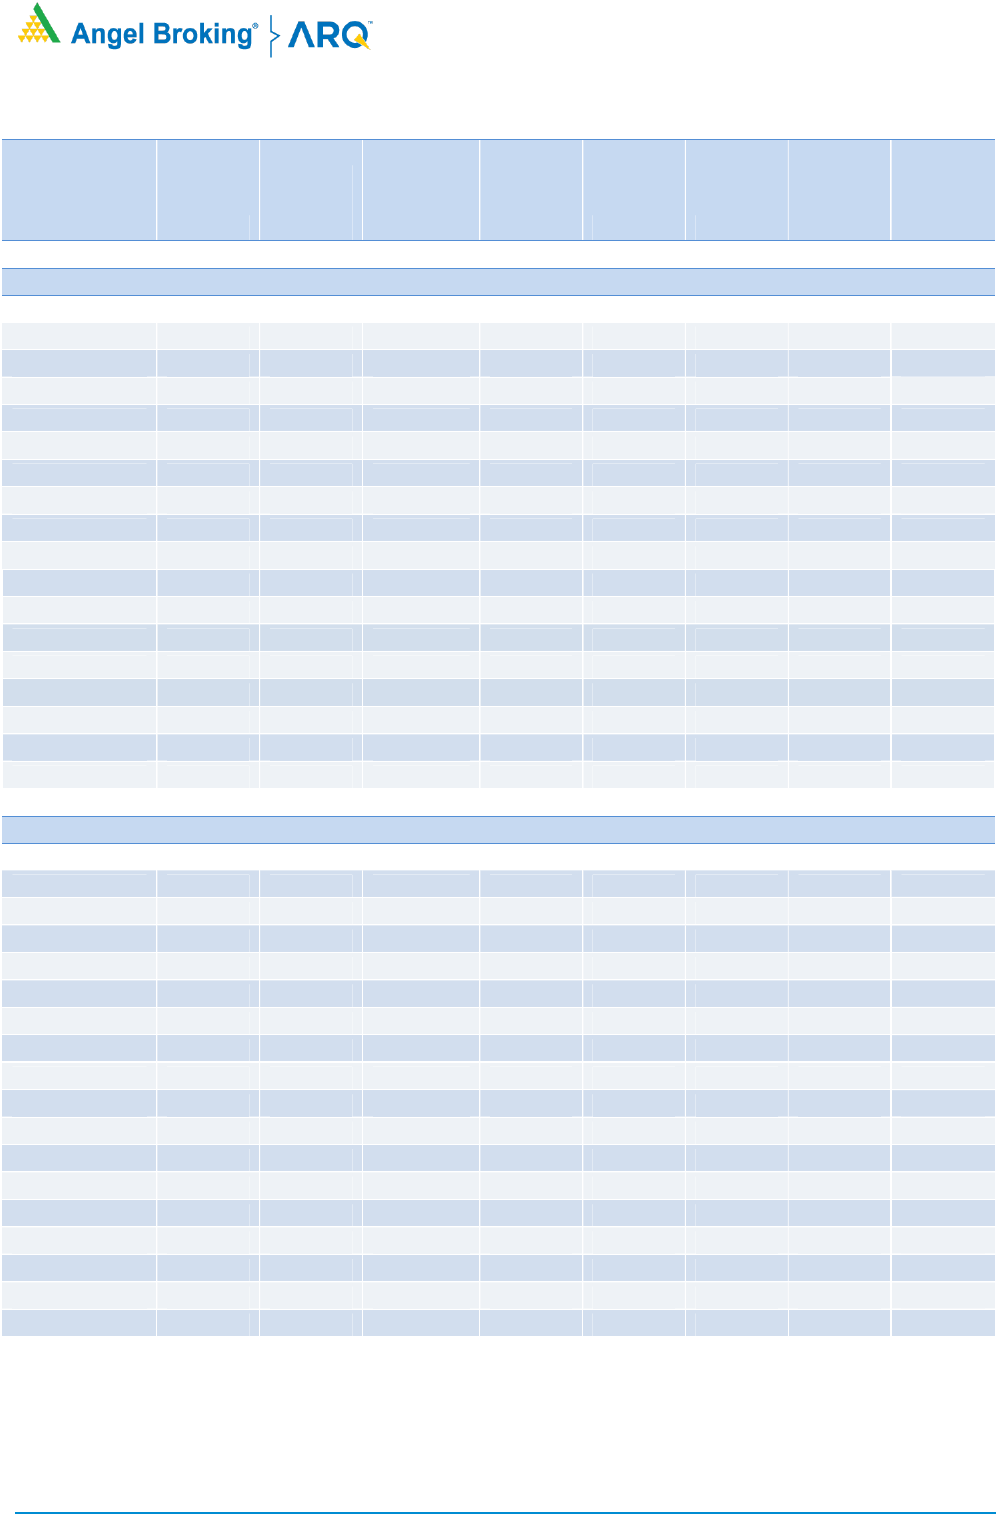
In F&O space, we did see decent long formation in Nifty and these positions have been rolled over too. The rollover for Nifty stood
at
77% which is above the three month average. For the banking index rollover stood at 79% which prima facie may look strong; ho
wever,
considering the open interest series on series it’s on the lower side. Interestingly, stronger hands continued pouring l
iquidity since May
2020 (except September), they bought equities worth Rs. 57,604 crores in November series which is highest single month buying figure
.
Unlike last series, they have been net buyers in the index futures and they also preferred rolling over
same to December series. As a result,
their ‘Long Short Ratio’ has surged from 44% to 77% series on series. The above rollover data remains positive but one should
prefer
trading in individual counters for the better risk reward ratio. For the coming week
, 13500 call and 12800 puts are attracting trader’s
attention.
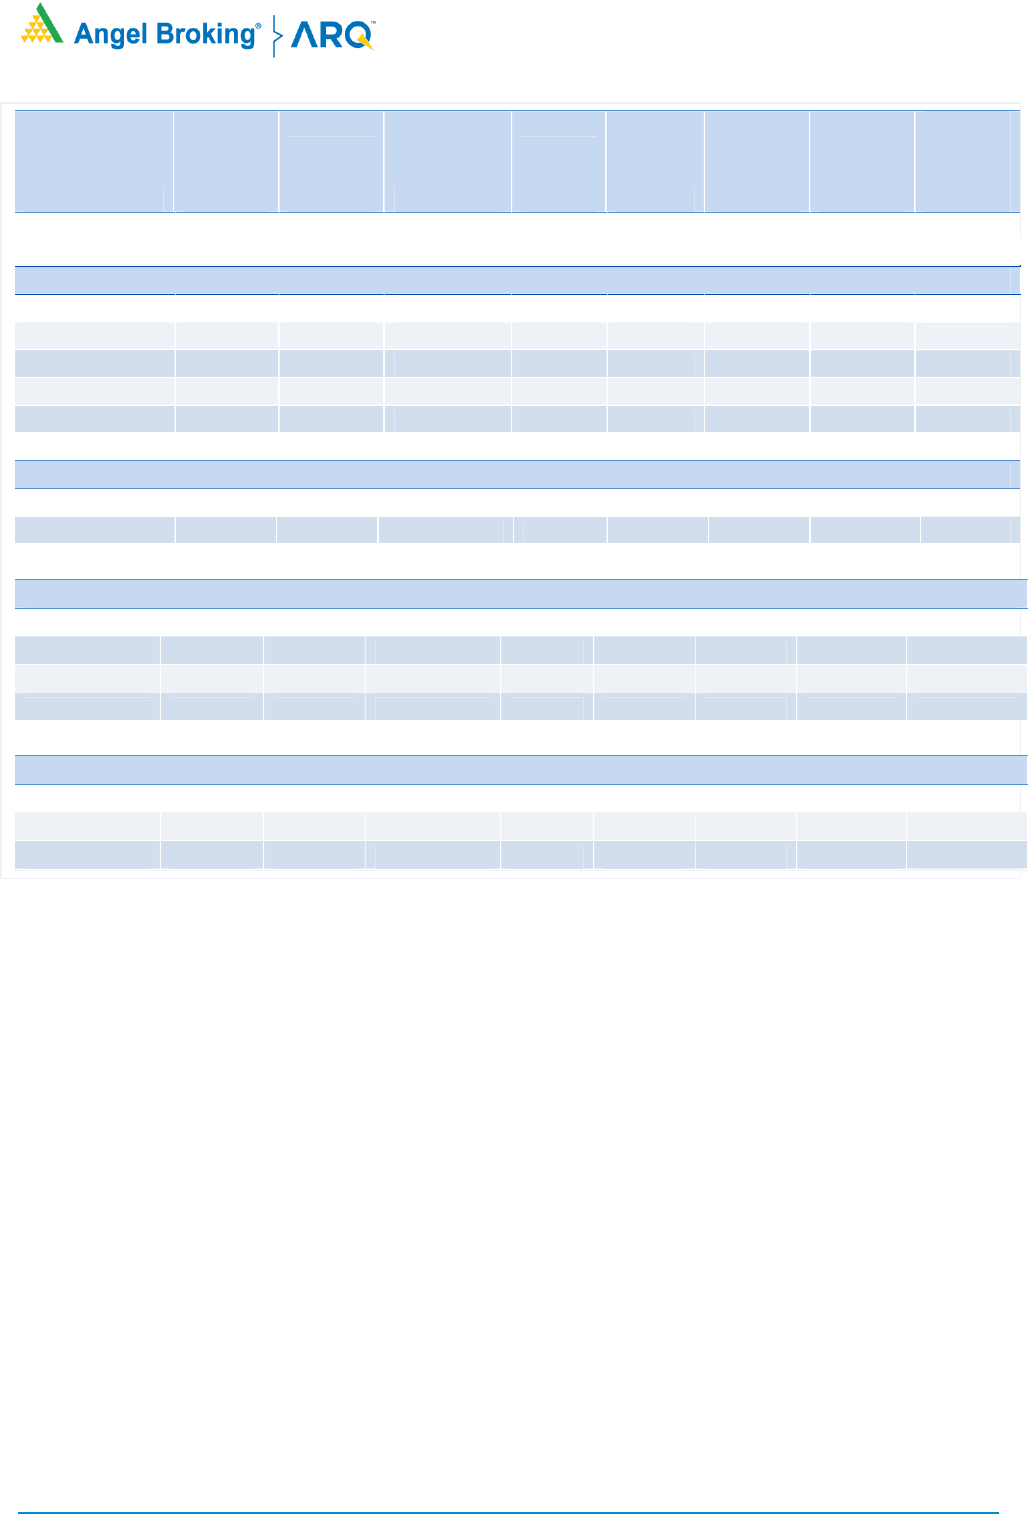
Indices Change
INDEX Price
Price
Change
(%) Rollover
3 month
avg.
NIFTY 12987.00 11.61
78.68 75.59
BANKNIFTY 29549.75 22.83
79.35 77.33
- - - - -
- - - - -
- - - - -
Derivatives Rollover Report
For Private Circulation Only
2
Scrip Price
Price
Change
(%) OI Futures
OI
Change
(%) COC (%) PCR-OI
Rollover
(%)
Average
Rollover
(3month)
(%)
AUTO & AUTO ANCILLARIES
AMARAJABAT 889.25 19.43
1029000 3.63 -4.55 0.10 92.70 88.17
APOLLOTYRE 176.15 22.92
8205000 (17.37) 7.45 0.66 89.62 87.87
ASHOKLEY 89.50 11.04
32571000 (11.86) 7.63 0.57 90.70 91.09
BAJAJ-AUTO 3145.55 7.44
2078000 (1.97) 5.45 0.30 97.15 97.50
BALKRISIND 1615.80 20.28
1312400 (16.13) 5.97 0.64 90.39 94.41
BHARATFORG 515.80 13.03
5298000 (6.93) 5.28 0.20 94.92 93.05
BOSCHLTD 12531.25 6.27
286900 92.49 -20.01 0.28 97.19 98.63
EICHERMOT 2563.75 19.89
2153900 (3.44) 5.93 0.73 95.40 96.77
ESCORTS 1395.15 17.03
2339150 (15.88) 5.79 1.24 85.57 90.99
EXIDEIND 173.80 10.28
12538800 13.94 6.95 0.47 96.59 94.12
HEROMOTOCO 3029.80 4.51
3118800 13.65 1.81 0.61 97.63 96.33
M&M 732.10 23.29
14908600 6.89 5.15 0.63 94.05 95.51
MARUTI 7022.65 (1.46) 3125500 28.70 4.24 0.54 98.85 96.32
MOTHERSUMI 144.20 34.20
16926000 (22.03) 7.28 0.83 90.60 93.50
MRF 75814.70 12.68
33420 31.83 -0.14 0.05 95.46 94.87
TATAMOTORS 175.60 32.93
58128600 (21.91) 11.10 0.80 75.61 89.50
TVSMOTOR 477.25 12.80
5061000 12.30 5.71 0.30 96.25 90.46
BANKING & FINANCIALS
AXISBANK 616.05 24.32
52396800 (0.38) 5.96 0.65 94.40 96.40
BAJAJFINSV 8835.65 56.97
907250 (24.77) 3.39 0.97 88.70 92.68
BAJFINANCE 4825.00 43.08
4984000 24.15 0.79 0.91 91.55 93.68
BANKBARODA 51.50 19.77
58639400 21.97 7.14 0.39 94.74 94.10
CANBK 100.35 18.06
14456800 15.29 3.65 0.43 89.70 91.16
CHOLAFIN 361.25 44.41
4490000 2.10 3.04 0.52 86.39 88.05
FEDERALBNK
60.20
17.46
99608500
16.33
6.10
0.49
94.96
95.85
HDFC 2247.85 15.79
26175000 5.49 4.40 0.45 96.85 97.51
HDFCBANK 1425.80 19.81
29267150 (18.77) -0.62 0.69 94.38 95.87
IBULHSGFIN 187.05 33.04
16327700 4.28 7.58 0.36 88.60 86.30
ICICIBANK 477.65 19.31
116557375 (1.85) 5.16 0.53 96.58 97.53
ICICIPRULI 456.35 11.44
6820500 (8.49) 4.48 0.31 89.17 93.88
INDUSINDBK 855.35 44.75
16529000 (38.48) 5.89 0.94 93.09 95.69
KOTAKBANK 1886.25 20.64
14835600 6.54 -1.57 0.79 93.11 94.10
L&TFH 78.10 22.41
27504700 3.55 -2.66 0.34 78.60 82.80
LICHSGFIN 327.05 13.62
11722000 29.90 5.29 0.40 94.96 94.40
M&MFIN 168.00 38.44
17558316 (12.22) 4.36 0.41 92.84 92.77
Derivatives Rollover Report
For Private Circulation Only
3
Scrip Price
Price
Change
(%) OI Futures
OI
Change
(%) COC (%) PCR-OI
Rollover
(%)
Average
Rollover
(3month)
(%)
MANAPPURAM 173.65 10.39
19746000 31.01 6.04 0.41 97.31 92.39
MFSL 641.10 8.72
3861000 106.54 6.47 0.49 96.21 95.63
MUTHOOTFIN 1137.05 (8.30) 5232000 99.94 4.65 0.50 96.75 96.03
PFC 109.35 27.89
30609400 (29.47) 2.39 0.40 67.85 86.46
PNB 32.25 20.79
64832000 (0.18) 6.51 0.46 94.92 92.16
RBLBANK 223.05 27.49
19138200 27.62 3.05 0.97 93.45 92.98
RECLTD 122.50 21.65
22398000 (0.51) 5.13 0.33 93.26 93.02
SBIN 246.60 30.24
87657000 (22.79) 4.89 0.81 90.39 94.01
SRTRANSFIN 1052.95 51.05
3131823 (7.48) 1.24 0.62 92.04 90.34
CAPITAL GOODS & INFRASTRUCTURE
ADANIPORTS 412.00 19.75
53435000 90.91 4.70 0.32 98.45 98.56
BHEL 31.65 13.64
70980000 28.03 6.63 0.51 95.59 93.19
GMRINFRA 25.95 11.13
61065000 (9.65) 4.03 0.29 95.73 93.64
HAVELLS 808.10 11.18
3877000 (33.17) 6.36 0.33 82.72 92.99
LT 1125.90 22.46
14320025 8.27 6.57 0.43 95.59 94.46
SIEMENS 1527.50 18.73
1742950 (1.18) 7.32 0.80 89.82 95.42
VOLTAS 770.75 9.29
2660000 64.00 2.24 0.47 91.10 89.39
CEMENT
ACC 1699.25 2.55
1429000 (4.29) 4.13 0.27 95.55 92.03
AMBUJACEM 261.65 2.69
14406000 (4.68) 3.60 0.47 96.74 94.44
GRASIM 879.50 13.85
18622850 1.87 2.50 0.55 98.45 98.79
RAMCOCEM 866.40 9.68
1393150 0.99 6.72 0.00 96.53 94.14
SHREECEM 24492.35 12.95
134050 1.21 4.75 0.08 98.42 96.45
ULTRACEMCO 4863.95 5.99
1759400 (12.61) 6.43 0.53 95.50 96.94
CHEMICAL & FERTILIZERS
CHEMICALS & FERTILIZERS
PIDILITIND 1543.95 (3.16) 3075000 (8.85) 7.04 1.23 97.68 97.08
TATACHEM
383.60
17.61
3996000
5.10
0.82
0.38
88.33
90.77
UPL
422.85
(6.45)
23719800
36.81
5.70
0.61
96.97
93.74
Consumer Goods & FMCG
ASIANPAINT 2166.10 (2.71) 3579600 25.47 5.23 0.84 98.30 92.14
BERGEPAINT 641.60 1.37
2412300 (31.32) 4.08 0.92 80.89 90.34
BRITANNIA 3566.10 0.69
1352800 23.77 5.10 0.69 97.60 92.51
COLPAL 1527.75 (0.03) 1829100 (28.96) 5.63 0.96 90.54 93.74
CONCOR
556.00
(5.86)
7139784
40.51
7.43
0.32
99.05
94.03
Derivatives Rollover Report
For Private Circulation Only
4
Scrip Price
Price
Change
(%) OI Futures
OI
Change
(%) COC (%) PCR-OI
Rollover
(%)
Average
Rollover
(3month)
(%)
DABUR 505.60 (2.67) 15117500 36.53 3.10 0.59 96.64 97.36
GODREJCP 703.50 2.75
3832000 (13.96) 3.57 0.26 95.80 90.31
HINDUNILVR 2161.25 1.58
6909600 27.54 3.41 0.75 98.52 83.21
ITC 195.65 19.19
93305600 (14.29) 4.55 0.49 94.08 93.79
JUBLFOOD 2510.35 12.80
1875250 10.57 5.97 0.50 94.72 92.77
MARICO 376.00 4.29
9466000 (6.89) 5.72 0.12 93.74 96.86
MCDOWELL-N 559.80 10.51
10793750 (19.28) 5.24 0.45 97.74 97.22
NESTLEIND 17737.80 4.91
225600 (48.50) -0.27 0.48 69.54 87.66
TATACONSUM 522.90 6.03
13639050 (26.59) 6.12 0.40 96.08 95.34
TITAN 1334.65 13.15
5769750 4.79 5.70 0.36 95.70 95.63
UBL
1052.40
15.50
1227100
(28.04)
6.63
0.22
87.91
89.73
METALS & MINING
COALINDIA 125.85 13.33
29822400 (31.03) 6.67 0.49 90.44 89.97
HINDALCO 231.00 37.01
28693900 (4.44) 4.99 0.57 92.19 94.91
JINDALSTEL 251.00 31.79
24505000 2.77 5.85 0.62 94.38 95.32
JSWSTEEL 360.50 17.10
37786500 (3.71) 3.77 0.82 97.76 97.94
NATIONALUM 37.55 24.75
25517000 (38.78) -4.15 0.41 68.60 84.16
NMDC 96.90 19.70
31007600 12.00 5.95 0.31 92.95 84.95
SAIL 46.90 38.96
43016000 (15.62) 7.84 1.63 84.45 90.53
TATASTEEL 571.65 41.99
39339700 44.07 5.96 0.83 95.98 96.37
VEDL 119.60 24.78
109541600 55.76 7.02 0.53 95.72 94.08
Media
PVR 1307.95 24.72
1211232 (25.38) -3.10 0.34 75.76 84.82
SUNTV
423.00
0.52
5631000
19.78
6.57
0.89
96.03
94.97
INFORMATION TECHNOLOGY
HCLTECH 844.80 0.41
19401200 41.99 3.41 0.49 98.62 96.32
INFY 1118.20 3.71
38695800 17.47 4.68 0.45 96.73 91.85
MINDTREE 1400.90 6.06
1433600 9.54 6.89 0.41 93.28 89.94
COFORGE 2464.75 11.55
532500 58.84 5.72 0.14 89.82 84.83
TCS 2732.75 3.63
5841600 (4.07) 4.66 0.71 96.12 83.11
TECHM 862.30 7.05
10306800 (7.68) 6.39 0.59 95.93 96.19
WIPRO 354.00 4.98
24409600 (4.94) -2.50 0.39 91.96 90.96
Derivatives Rollover Report
For Private Circulation Only
5
Scrip Price
Price
Change
(%) OI Futures
OI
Change
(%) COC (%) PCR-OI
Rollover
(%)
Average
Rollover
(3month)
(%)
INFORMATION TECHNOLOGY
HCLTECH 564.00
(0.70)
22885800
(1.26)
8.14
0.58
98.56
96.78
INFY 730.55
3.77
24351600
(52.50)
2.86
0.74
55.98
79.52
MINDTREE 782.95
10.93
1041600
(14.29)
-15.63
0.59
93.13
93.37
NIITTECH 1606.65
6.68
578250
26.08
-2.03
0.46
89.76
82.99
TCS 2212.80
6.19
15671500
(17.22)
6.42
1.91
95.02
94.74
TECHM 775.75
1.00
15406800
8.21
9.05
0.65
96.29
97.15
WIPRO 249.90
3.65
18211200
(29.64)
-2.08
0.72
83.12
92.60
MISCELLANIOUS
ADANIENT 330.55 21.53
16936000 8.98 6.58 0.33 97.85 96.24
APOLLOHOSP 2091.70 8.03
1607500 32.74 3.76 0.31 85.71 89.55
BATAINDIA 1305.45 0.47
1286450 (14.10) 2.07 1.27 96.02 94.36
BEL 86.95 (4.13) 29822400 (6.12) 4.68 0.85 94.94 91.88
CONCOR 384.95 3.41
5204790 (7.01) 3.70 0.40 97.63 92.88
CUMMINSIND 443.00 1.48
1436400 (24.05) 4.13 1.11 84.18 90.07
INDIGO 1333.80 11.74
2512500 (16.47) 2.95 0.72 96.56 91.30
OIL & GAS
BPCL 380.15 10.83
19378800 (17.11) 5.93 0.71 91.49 93.02
GAIL 103.15 23.53
18983200 (22.34) 4.06 0.34 80.33 87.27
HINDPETRO 214.00 18.82
26865000 (20.43) 4.16 0.89 92.81 94.53
IGL 448.45 10.18
3961375 (16.71) 0.70 0.36 94.46 94.93
IOC 86.00 9.28
49077800 (7.47) 4.87 0.46 89.17 92.56
MGL
935.05
14.56
1289400
(24.89)
6.73
0.47
94.21
93.51
ONGC 80.45 24.54
39562600 (14.14) 3.25 0.40 85.15 88.59
PETRONET 257.55 12.22
9837000 56.97 6.31 0.30 92.11 83.67
RELIANCE 1959.20 (3.62) 35924360 (1.93) 3.50 0.65 95.91 94.31
PHARMACEUTICAL
AUROPHARMA 873.35 13.63
11777350 (8.37) 3.17 0.65 98.49 96.56
BIOCON 428.35 6.09
10080900 (15.78) 6.37 0.55 97.68 96.13
CADILAHC 425.35 3.08
6028000 13.93 7.53 0.51 96.24 95.59
CIPLA 743.00 (2.60) 17066400 14.78 6.14 0.76 95.68 96.90
DIVISLAB
3561.15
14.25
2248000
(29.81)
4.94
0.50
95.72
96.80
DRREDDY 4918.35 (0.53) 3604875 13.49 3.64 0.53 98.50 96.45
GLENMARK 471.75 0.07
5460200 (14.17) 6.34 0.90 95.84 95.90
LUPIN 904.90 (2.54) 8856150 40.12 6.20 0.57 95.46 88.91
PEL 1432.40 17.45
2858900 2.38 6.37 0.53 94.82 95.95
SUNPHARMA 513.60 12.15
43563800 0.84 3.87 0.63 97.87 97.25
TORNTPHARM 2624.90 3.78
916250 (17.08) 3.67 0.58 98.36 97.32
Derivatives Rollover Report
For Private Circulation Only
6
Scrip Price
Price
Change
(%) OI Futures
OI
Change
(%) COC (%) PCR-OI
Rollover
(%)
A
verage
Rollover
(3month)
(%)
POWER
NTPC 94.65 9.36
44727900 (18.49) 6.10 0.39 93.64 90.01
POWERGRID 194.40 13.58
12416000 (9.56) -17.15 0.57 85.44 86.33
TATAPOWER 62.75 19.98
102924000 43.31 6.69 0.44 97.38 97.21
TORNTPOWER 308.65 1.11
3750000 69.15 6.46 0.09 96.90 94.31
REAL ESTATE
DLF 185.40 20.55
27852000 (2.61) 5.37 0.74 96.18 96.37
TELECOM
BHARTIARTL 470.75 4.06
95452368 (11.40) 5.23 0.77 98.05 97.38
IDEA 10.00 19.05
491190000 110.72 5.24 0.48 96.10 86.04
INFRATEL 212.70 15.66
10701600 (5.18) -29.54 0.46 88.47 91.22
TEXTILES
PAGEIND 22909.30 14.89
90210 27.90 3.33 0.00 94.59 92.48
SRF 5109.00 14.77
509500 (2.81) 6.75 0.32 92.34 94.71

Derivatives Rollover Report
For Private Circulation Only
7
Technical and Derivatives Team:
Sameet Chavan Chief Analyst - Technical & Derivatives sameet.chavan@angelbroking.com
Ruchit Jain Senior Analyst - Technical & Derivatives ruchit.jain@angelbroking.com
Rajesh Bhosale Technical Analyst rajesh.bhosle@angelbroking.com
Sneha Seth Derivatives Analyst sneha.seth@angelbroking.com
Research Team Tel: 022 - 39357600 (EXTN - 6844) Website: www.angelbroking.com
For Technical & Derivative Queries E-mail: technicalresearch-cso@angelbroking.com
DISCLAIMER
Angel Broking Limited (hereinafter referred to as “Angel”) is a registered Member of National Stock Exchange of India Limited,
Bombay Stock Exchange Limited and Metropolitan Stock Exchange Limited. It is also registered as a Depository Participant with
CDSL and Portfolio Manager and Investment Adviser with SEBI. It also has registration with AMFI as a Mutual Fund Distributor.
Angel Broking Limited is a registered entity with SEBI for Research Analyst in terms of SEBI (Research Analyst) Regulations, 2014
vide registration number INH000000164. Angel or its associates has not been debarred/ suspended by SEBI or any other regulatory
authority for accessing /dealing in securities Market. Angel or its associates/analyst has not received any compensation / managed
or co-managed public offering of securities of the company covered by Analyst during the past twelve months.
This document is solely for the personal information of the recipient, and must not be singularly used as the basis of any
investment decision. Nothing in this document should be construed as investment or financial advice. Each recipient of this
document should make such investigations as they deem necessary to arrive at an independent evaluation of an investment in the
securities of the companies referred to in this document (including the merits and risks involved), and should consult their own
advisors to determine the merits and risks of such an investment.
Reports based on technical and derivative analysis center on studying charts of a stock's price movement, outstanding positions
and trading volume, as opposed to focusing on a company's fundamentals and, as such, may not match with a report on a
company's fundamentals. Investors are advised to refer the Fundamental and Technical Research Reports available on our website
to evaluate the contrary view, if any.
The information in this document has been printed on the basis of publicly available information, internal data and other reliable
sources believed to be true, but we do not represent that it is accurate or complete and it should not be relied on as such, as this
document is for general guidance only. Angel Broking Limited or any of its affiliates/ group companies shall not be in any way
responsible for any loss or damage that may arise to any person from any inadvertent error in the information contained in this
report. Angel Broking Limited has not independently verified all the information contained within this document. Accordingly, we
cannot testify, nor make any representation or warranty, express or implied, to the accuracy, contents or data contained within this
document. While Angel Broking Limited endeavors to update on a reasonable basis the information discussed in this material,
there may be regulatory, compliance, or other reasons that prevent us from doing so.
This document is being supplied to you solely for your information, and its contents, information or data may not be reproduced,
redistributed or passed on, directly or indirectly.
Neither Angel Broking Limited, nor its directors, employees or affiliates shall be liable for any loss or damage that may arise from or
in connection with the use of this information.
